

This analysis provides a follow-up to teacher preparation trends discussed in Mississippi First’s Nothing in the Pipes: Educator Crisis in Mississippi, which was published in December 2020 and represents our first major report on the ongoing teacher shortage in Mississippi.
In Nothing in the Pipes: Educator Crisis in Mississippi, we make the case that the decline in new teachers is, at least in part, a result of the rising cost of college and the declining value of teacher salaries. Though our report draws on data from a variety of sources, central to our analysis is teacher preparation data gleaned from the US Department of Education’s (ED) annual Title II report. Since the release of Nothing in the Pipes, ED has published an additional year of Title II data (a 2-3 year lag means this data is from 2018-2019 this year), which provides us a great opportunity to examine whether the teacher preparation trends we observed from 2008-2009 to 2017-2018 are continuing.
Below, we provide highlights from our analysis of 2018-2019 Title II data, with particular attention to whether our findings represent a continuation from those described in Nothing in the Pipes.
(One thing to note about ED’s latest Title II report is that the definition of “enrollment” has been expanded to include enrolled students who are also graduating in the same year; previously, “enrollment” and “program completers” were mutually exclusive categories. The new definition is logical, but this change is not clearly publicized on the Title II website. Enrollment data from previous years has also not been adjusted to reflect the new definition. As such, looking at year-to-year trends, there appears to be a massive increase in enrollment going into 2018-2019. This is erroneous. To account for this change in definition, any pre-2018-2019 enrollment figures we cite will be the sum of enrollment and program completers in that given year, whereas 2018-2019 and forward data will reflect the newly defined “enrollment” data as listed by Title II. Additionally, any discussion of year-to-year enrollment demographics will refer only to percentages, as, prior to this year, demographics were reported only for enrollment and not for completers.)
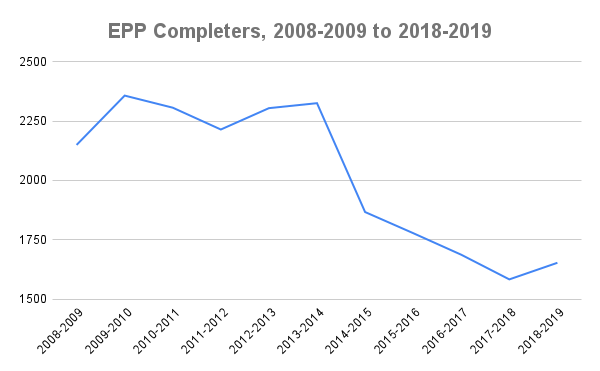
From 2017-2018 to 2018-2019 the number of EPP completers climbed from 1,583 to 1,653, a 4.4% increase (70 additional graduates). As we highlight in Nothing in the Pipes, the number of annual completers had previously been dropping precipitously since 2013-2014 (a 32% decrease in four years). A 4.4% bump is far below what is required to reverse Mississippi’s critical teacher shortage, but 2018-2019 was the first time the number of in-state EPP graduates increased since 2013-2014, even if the number was small. This growth in the number of EPP completers is evenly distributed across the traditional (+4.2%) and alternate (+4.8%) routes, though EPPs at private colleges and universities (+7.5%) outperformed public EPPs (+4.4%) by about three percentage points.
Overall, the change in overall enrollment (i.e., a combination of graduating and non-graduating teacher candidates) is much more muted, with a 0.2% decrease from 4,234 enrolled teacher candidates in 2017-2018 to 4,224 in 2018-2019 (10 fewer students). Flat enrollment does not bode terribly well for the number of future graduates. Since graduates increased but overall enrollment actually declined, it means that fewer students were newly enrolled in 2018-2019 than 2017-2018. There is one upside worth mentioning: consistent with a trend we articulated in Nothing in the Pipes, a higher proportion of enrolled teacher candidates made it to graduation in 2018-2019 than in 2017-2018. What this means is that for students who do enroll in teacher preparation, EPPs appear to be doing a better job of preventing attrition (i.e., changing majors or dropping out).
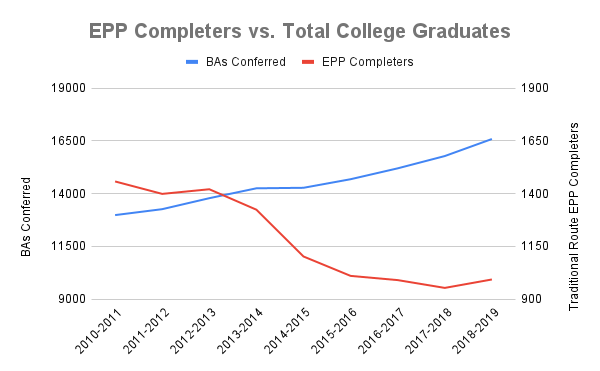
One of the most troubling findings in Nothing in the Pipes is that the decline in EPP completers from 2013-2014 to 2017-2018 coincided with a statewide increase in college graduates, indicating that a driving factor behind the critical teacher shortage is heightened disinterest and outright avoidance of teacher preparation by college students. Despite the slight increase in traditional route teacher candidates graduating college in 2018-2019, teacher graduates nonetheless shrank as a percentage of overall Mississippi college graduates (from 6.04% in 2017-2018 to 5.98% in 2018-2019) as a result of overall Mississippi college graduates increasing faster. This most recent decline is smaller than previous year-to-year drops (the average annual decline from 2010-2011 to 2017-2018 was about .74 percentage points; it is only .06 percentage points this year), but these figures continue to move in the wrong direction.
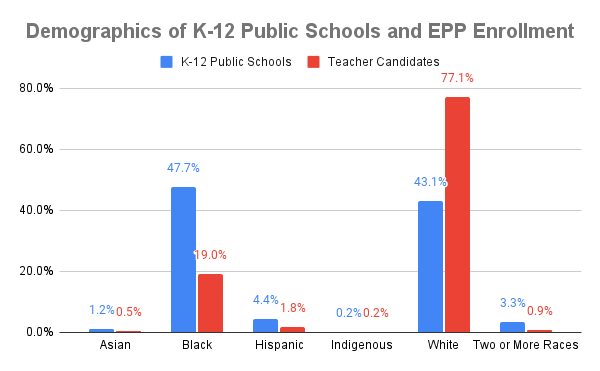
Black teacher candidates accounted for just 19% of statewide EPP enrollment in 2018-2019, down two percentage points from the previous year. In traditional route programs (i.e., at the undergraduate level), the situation is even worse, with Black students comprising just 13% of enrollment. Traditional route programs at private colleges and universities saw the proportion of Black teacher candidates fall nine percentage points to 11%. Remember this is in a state with a K-12 student population that is 48% Black.
2018-2019 did see EPP enrollment at HBCUs jump from 198 to 306 (a whopping 55% increase, largely thanks to Mississippi Valley State University’s massive 535% expansion from 20 to 127 traditional and alternate route teacher candidates), but this was not enough to offset the steady whitening of Mississippi’s educator pipeline over the last decade. Consistent with trends we noted in Nothing in the Pipes, this issue is particularly acute at the “Big 3” universities (University of Mississippi, Mississippi State, and University of Southern Mississippi), which often account for over 50% of statewide EPP enrollment in a given year. Black students comprised just 6.9% of enrollment at Big 3 EPPs in 2018-2019, down from 8.2% in 2017-2018. Black students at the Big 3 now make up a similar percentage to white students at HBCUs.
New in 2021, Title II reports now present demographics for EPP completers (previously demographics were only reported for enrollment). In 2018-2019, Black teacher candidates made up 15% of EPP completers, compared to 19% of EPP enrollment. It is somewhat difficult to discern a greater pattern here without data from previous years, but this gap suggests that attrition for Black EPP candidates may be higher than for their white peers. In the coming years we will closely monitor this metric and its implications.
In Nothing in the Pipes, we highlight the fact that licenses issued to out-of-state EPP completers fell 96% from 905 in 2010-2011 to just 33 in 2017-2018, obliterating the supply of teachers from across the nation. In 2018-2019, this figure stood at 34, an increase of a single teacher.