By Toren Ballard I Director of K-12 Policy
This fall, Mississippians received two widely divergent narratives about the state of public education post-COVID:
On September 29, the Mississippi Department of Education (MDE) released school and district accountability grades for the 2021-2022 school year, showing unprecedented improvement: 87% of districts were rated “C” or higher, up from 70% in 2019, the last time MDE released accountability grades. The number of “F” districts declined from 19 to just five. A whopping 16 districts managed to improve by at least two grades (e.g., “D” to “B”), including Hattiesburg Public School District and Claiborne County School District, each of which improved three grade levels (Hattiesburg from “D” to “A”; Claiborne County from “F” to “B”).
Districts across the state were midway through a victory lap when, just weeks later, the U.S. Department of Education released national and state-level results from the National Assessment of Educational Progress (NAEP). Known as “the Nation’s Report Card,” NAEP is administered every few years to a representative sample of 4th and 8th graders across the United States to measure student achievement in reading and math. In the wake of COVID-19, predictions of widespread declines in reading and math scores proved to be correct: nationally, math scores fell by the largest amount on record to levels not seen since the early 2000s. Reading scores did not fall quite as much in point value, but they are now on par with scores in 1992. Though Mississippi had emerged over the past decade as demonstrating some of the highest NAEP gains in the nation, our 2022 state scores were similarly dismal, with the notable exception of 4th grade reading scores, which remained essentially unchanged from three years prior.
Average NAEP Scores: Mississippi, 2019-2022
| 4th Grade Math | 4th Grade Reading | 8th Grade Math | 8th Grade Reading | |
|---|---|---|---|---|
| 2019 | 240.71 | 219.34 | 273.73 | 256.38 |
| 2022 | 233.56 | 217.16 | 265.57 | 252.93 |
| Change | -7.15 | -2.18* | -8.16 | -3.45 |
What, exactly, do district grades and NAEP scores measure?
As we try to make sense of how Mississippi students in 2022 compare with one another, with students in other states, and with their pre-pandemic selves, it is fair to ask how the two primary mechanisms for measuring educational performance—NAEP and the Mississippi Statewide Accountability System—have produced such contrasting results.
To start, we should be very clear about the differences between NAEP and accountability grades. NAEP is designed to be a “common yardstick” for student achievement in reading and math regardless of location or year, meaning it is intended for apples-to-apples comparisons over time and between states. School and district accountability grades, on the other hand, are a composite indicator of school and district performance using a variety of measures, most of which are centered around achievement on the Mississippi Academic Assessment Program (MAAP) exams. Some of these measures provide apples-to-apples comparisons over time or between districts (such as the percent of students scoring proficient on MAAP exams), but other measures must be interpreted in the context of a given district at a given time (namely the rate of individual students meeting growth goals). So while accountability grades are used for comparisons between districts and over time, they are primarily intended to generally communicate to stakeholders in a given year “how well their local schools and districts are serving their students,” as MDE puts it.
Unprecedented learning loss—and recovery?
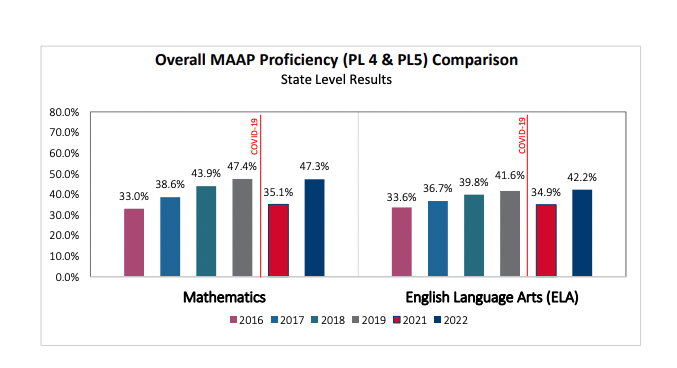
So what happened from 2019 to 2022? After the last “normal” testing year in 2019, school closures in Spring 2020 prevented students from taking the 2020 MAAP exams. The following year, in 2021, students did take MAAP, but the state opted not to calculate accountability grades considering pandemic disruptions to schooling. Proficiency data from that testing year shows the extent of COVID-related learning loss: statewide proficiency rates fell by 12.3 percentage points in math and 6.7 percentage points in reading. The bottom 10 districts in math proficiency each had rates below 5%.

In 2021-2022, students experienced a school year far less disrupted than the prior two years, and 2022 MAAP results reflected this reality: statewide proficiency rates in math were essentially at 2019 pre-pandemic levels, and statewide reading proficiency exceeded pre-pandemic levels by a whisper, about half a percentage point. The extent to which students in particular districts reversed their pandemic learning loss varied, but an average of district data (averaging districtwide scores rather than all students in the state) showed slight declines from pre-pandemic levels in both subjects (-1.52 percentage points in math; -0.81 percentage points in reading). In general, this picture is one of students recovering, rather than continuing the upward trend in proficiency rates enjoyed by the state prior to the pandemic.
State proficiency data closely match what NAEP shows in fourth grade reading—that students have recovered but not improved since 2019. However, the large NAEP declines in math (Mississippi fell back to scores not seen since 2015) and the statistically significant, though much smaller, decline in eighth grade reading are troubling. For some time, state proficiency data and NAEP data have trended together, so this divergence may spell problems for the validity of our state test going forward. A more positive take is that the higher 2022 state data may presage a faster-than-expected NAEP recovery in 2024. Either way, the 2022 difference in state proficiency data and NAEP data does not explain the larger divergence between our declining NAEP performance and skyrocketing state accountability grades.
The flaw in the Statewide Accountability System that COVID exploited
If students are, by and large, demonstrating either similar or lower levels of student achievement than prior to the onset of COVID-19, why did districts receive such high accountability grades this fall? The short answer is that accountability grades take into account not only proficiency but also year-to-year student growth, and this additional factor, which is more than one-third of the accountability grades, offset low 2022 proficiency rates. In other words, the unprecedented slump in MAAP scores in 2021 created conditions for 2022’s equally unprecedented growth rates.
To illustrate, let’s examine the 16 districts that improved by at least two accountability grades in 2022. In 2019 (the last time MDE assigned accountability grades), all but one of these districts were rated either an “F” or a “D.” These districts are now all rated at least a “C” or higher, including two districts which now have “A” ratings. This should signal tremendous improvement over the course of three years, but all but two of these districts actually declined in proficiency in at least one subject from 2019 to 2022. Five districts declined in proficiency in at least two subjects. Two districts declined in three subjects, including one district, Claiborne County, which nonetheless improved from an “F” to a “B” during this time.
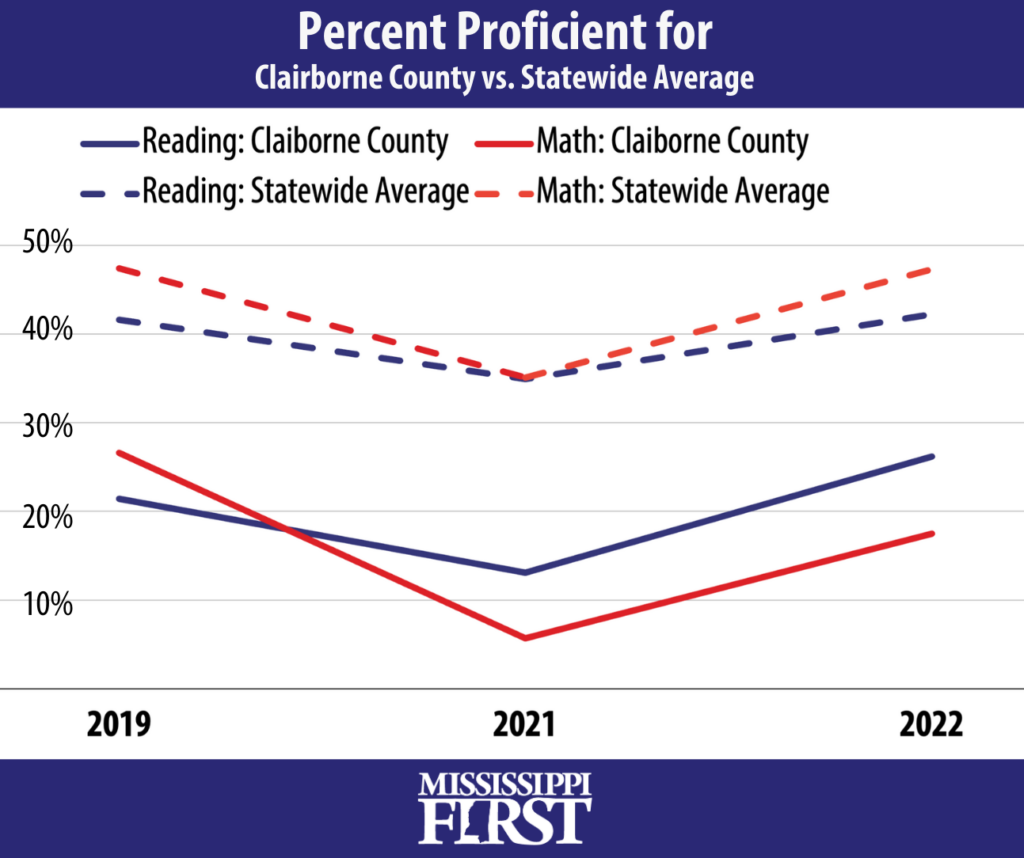
Remember, although proficiency rates were essentially unchanged from 2019, individual student growth was calculated using scores from 2021—the nadir of COVID-related learning loss—not 2019, the last “normal” testing year. Somewhat perversely, the larger a district’s decline in proficiency rates from 2019 to 2021, the easier it was to achieve extraordinary student growth from 2021 to 2022. These big growth scores propelled many districts to earn impressive accountability grades despite underperforming much of the state in 2022 as well as their own 2019 pre-pandemic performance. Consider the case of Claiborne County School District:

Proficiency rates in Claiborne County were far below statewide averages in 2019, 2021, and 2022. In 2019, these low proficiency rates were reflected in the district’s “F” accountability rating. Proficiency in the district fell even further in 2021, and although the state also experienced a big decline in proficiency, Claiborne County declined even more sharply from their already low level. In 2022, students in the district still underperformed compared to the statewide average and scored lower in math than they did in 2019 (they improved in reading from 2019), but the change in scores from 2021 to 2022 were enough to earn the district a large number of growth points, resulting in a “B” rating. Examples such as this are why MDE included the following disclaimer in its release of 2022 accountability grades:
“Though overall grades appear to have improved since 2019, state officials advise caution when interpreting score changes between the 2018-19 and 2021-22 school years. In particular, substantial shifts in performance may be temporarily influenced by factors associated with pandemic disruptions.”
Mississippi Department of Education I Press Release September 27, 2022
The flip side of this is, of course, that districts which did not decline as much in 2021 did not get as large a growth boost, making them look worse by comparison on the state grading scale, even if one could argue they did a better job throughout the pandemic period. Take Lincoln County School District, for instance. In 2019, Lincoln County had a “B” rating with proficiency rates in line with statewide averages (slightly higher than the statewide average in reading; slightly lower in math). In 2021, reading and math proficiency declined less than the statewide rates, and Lincoln County outperformed the statewide averages in both subjects. Proficiency improved in 2022, and Lincoln County again outperformed the statewide averages. But despite holding steady throughout the pandemic and outperforming the state, Lincoln County maintained its “B” rating in 2022—the same rating as Claiborne County.
| Clairborne County | Lincoln County | |
|---|---|---|
| Reading Proficiency | 26.2% | 47.7% |
| Math Proficiency | 17.5% | 48.5% |
| Accountability Grade | B | B |
Stakeholders should understand that the supercharged levels of growth in 2022 will be difficult or impossible to sustain in 2023 without supercharged proficiency rates. While we do expect some growth in proficiency statewide, districts with generally low or only slightly improved proficiency rates will see their accountability grades decline, some significantly. These circumstances are a reminder that measuring educational progress is difficult, and that results must be read and understood in context.

