

Editor’s Note: This blog post is part of an ongoing series of posts dedicated to K-12 education policy in Mississippi.
***

By Grace Breazeale I K-12 Policy Associate
Mississippi’s population of students who identify as English Language Learners (ELLs) has grown in recent decades, reflecting a nationwide trend. During the 2000-2001 school year, ELL students made up 0.4% of the state’s student population. By the 2022-2023 school year, this percentage had grown to 3.1%.
ELL students require unique support from their schools, as they have the added burden of learning English on top of their standard academic responsibilities. Often, providing an adequate level of support for these students can be a significant hurdle for school districts that are already short on resources. In this piece, we explore the state of ELL education across Mississippi, challenges that school districts face in providing support for students, and the varying academic performance of students across the state.
Increase in Population of English Language Learners
Before we dive into the data, we should establish a common definition of what it means for a student to be a part of the ELL population. In general, when a student’s parent or guardian registers the child for school, they fill out a Home Language Survey (HLS). This is used to determine the primary language that the student speaks at home. If survey responses indicate that the student uses a primary language other than English at their home, the student completes a language placement test (the LAS Links assessment) to determine their level of English proficiency. Students who score below a particular threshold on this test are classified as English Language Learners.
Immigration trends have contributed to a growing population of students learning English across the country. Though the students qualifying for ELL services in Mississippi’s student population is still relatively low compared to other states, it has grown significantly over the past several decades. The graph below demonstrates the increase in the state’s ELL students since the 2012-2013 school year.
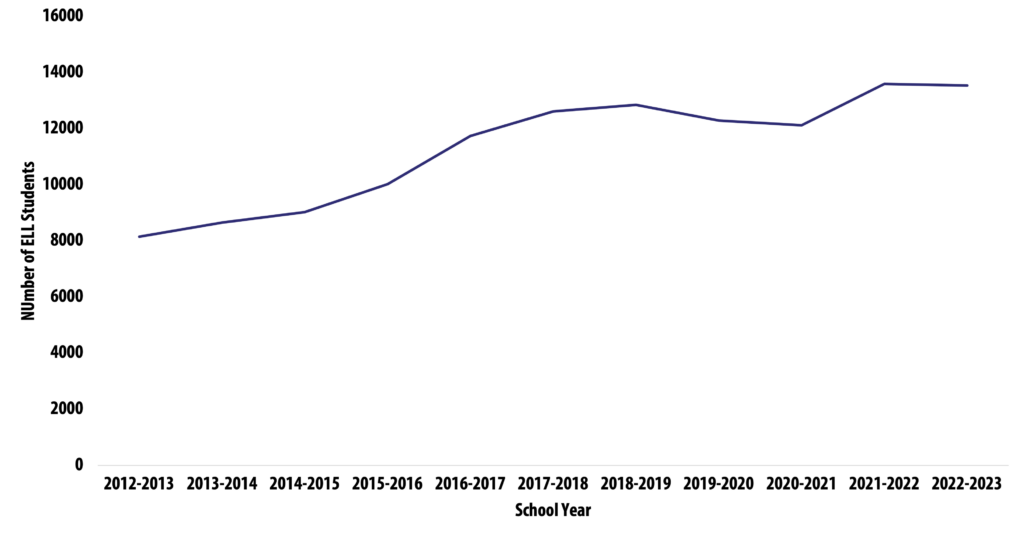
As the figure shows, the state’s ELL population increased significantly between 2012 and 2022, with the state now serving nearly 14,000 students (over 3% of its student population).
Examining where these students are located reveals that concentrations of ELL students vary widely by district. In Forest Municipal School District, for instance, ELL students comprise 31% of the student population. In the Greenville Public School District, they only make up 0.37% of the student population. A number of school districts have not identified any ELL students.
The growth of this population in many of our public schools creates a need for a robust system of support for these students. On the surface, it may seem that districts with large concentrations of ELL students would struggle the most with providing support, but this is not necessarily the case. In the following section, we explore some of the factors that can play a role in districts’ abilities to support ELL students.
Challenges In Supporting Students Learning English
Students across the state face various obstacles to academic success, from a lack of support at home to lack of resources at school. ELL students have the additional complication of learning English in addition to keeping up with their schoolwork.
According to federal regulations, school districts are required to “help ELL students overcome language barriers” and “ensure that they can participate meaningfully in the districts’ educational programs.” School districts have flexibility in the strategies and programs they can use to meet these goals, and the Mississippi Department of Education offers extensive guidance to help districts develop their plans to support their ELL students.
Unfortunately, the funding that school districts receive to support their ELL students is often inadequate. Mississippi is one of only two states that does not provide specific funding for ELL students in its school funding formula. Thus, districts must rely wholly on federal money from the Title III program to drive their programming for ELL students. This funding is limited: in 2023, districts only received from $130-$195 per ELL student. On top of this, districts that do not qualify to receive at least $10,000 in Title III funding for this population (i.e., serve approximately 70-80 ELL students) cannot directly apply to receive funding from the program.1 Districts in this situation have the option to join under a consortium to meet the funding threshold, but no such partnerships currently exist in the state. As a result, approximately 64.5% of districts with ELL students did not receive Title III funding during the 2022-2023 school year. Altogether, over 2,100 ELL students were enrolled in these districts. The lack of funding raises questions about why districts are not choosing to form consortiums to receive Title III funding and, consequently, the level of support that these districts are able to provide to ELL students.
In addition to inadequate funding, many teachers may enter the classroom without the background or knowledge needed to serve ELL students. Only seven of Mississippi’s eighteen Educator Preparation Programs (EPPs) give teachers the opportunity to earn an English as a Second Language (ESL) endorsement, and the number of teachers who hold this endorsement varies widely across districts. According to data from MDE, 35.5% of districts with ELL students did not have any teachers with this endorsement during the 2022-2023 school year. In total, there were over 900 ELL students in these districts. As a result of not having the requisite knowledge to serve ELL students, teachers may lean on strategies such as translating schoolwork into ELLs’ native languages, which, on its own, is insufficient for their learning.
The district-level variation in ESL-endorsed teachers, as well as the variation in the number of ELL students, is demonstrated in the graph below. Each point on the graph represents a school district in Mississippi. Note that many districts tend to have low numbers of ELL students, though there are more than a few that have over 100 ELL students. Also note that having a relatively large number of ELL students is not necessarily a guarantee that the district will have an adequate number of ESL-endorsed teachers.
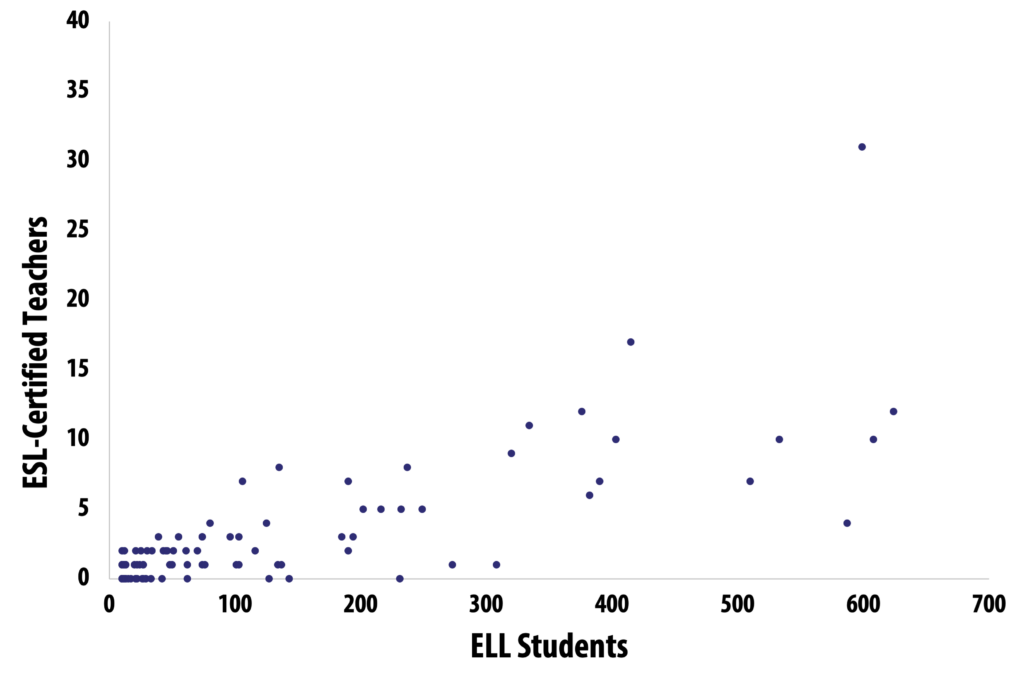
*Desoto County was excluded to improve visibility of other data points. Desoto County has 1567 ELL students and 67 ESL-endorsed teachers.
**Districts with no ELL students are excluded.
Student Performance
The additional support that ELL students may require, and the limited resources available to provide this support, raise questions about the quality of education these students are receiving. The academic performance of these students, as measured by standardized test scores, can provide clues about how well they are being served.
As in other states, there is a persistent achievement gap between ELL students and non-ELL students in both math and English Language Arts (ELA).
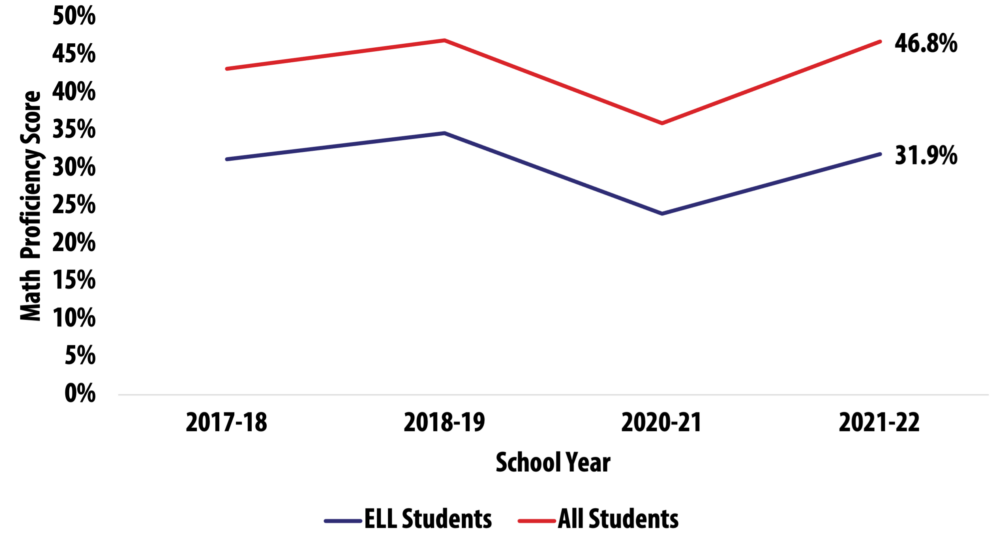
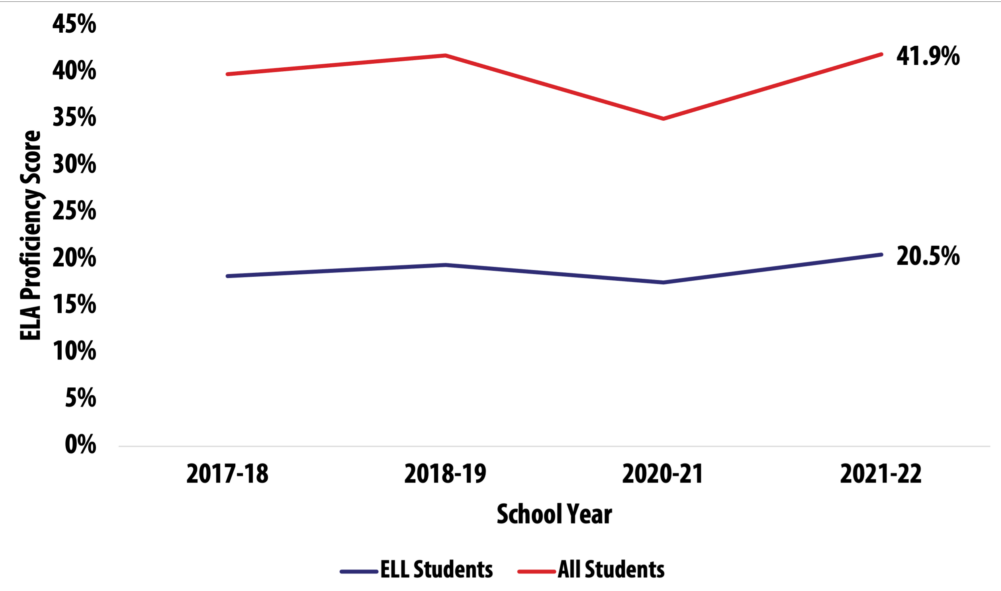
As the graphs demonstrate, the math achievement gap appears to have narrowed in the first school year of the pandemic (2020-2021) then widened in the year that followed. In ELA, the achievement gap was relatively consistent through the 2020-2021 school year then, as with math, grew during the 2021-2022 school year.
Comparing the two graphs shows that the gap in proficiency for ELA is greater than the gap for math. This is likely because math relies less on the language that ELL students are in the process of learning, so they have less of a hurdle to overcome.
Variation in Performance Across Districts
Given the differing concentrations and levels of support for ELLs, it is unsurprising that there is wide variation in the performance of these students across school districts.
As we demonstrated above, the average achievement gap was 21.4 percentage points in ELA and 14.9 percentage points in math during the 2021-2022 school year. However, on a district level, the math achievement gap varied from ELL students being 54.3 percentage points behind their non-ELL peers to ELL students being 34.8 percentage points ahead of their peers. In ELA, the achievement gap ranges from ELL students being 52.2 percentage points behind their non-ELL peers to being 11.1 percentage points ahead of their peers. Note that ELL students outscoring their non-ELL peers is the exception rather than the rule: this is only the case in three districts for ELA scores and seven districts for math scores.
There are numerous factors that could be related to the variation in scores. For the purpose of this post, we will focus on this one: districts in which non-ELL students have high proficiency scores tend to have higher achievement gaps than districts in which non-ELL students have low proficiency scores. The graphs below demonstrate this phenomenon, with each point on the graphs representing a school district. The x-axis on the graphs show the proficiency of non-ELL students in each subject, and the y-axis shows the difference in proficiency between ELL and non-ELL students. Note that a positive y-axis indicates ELL students are outperforming their non-ELL counterparts, and a negative y-axis indicates ELL students are performing below their non-ELL counterparts.
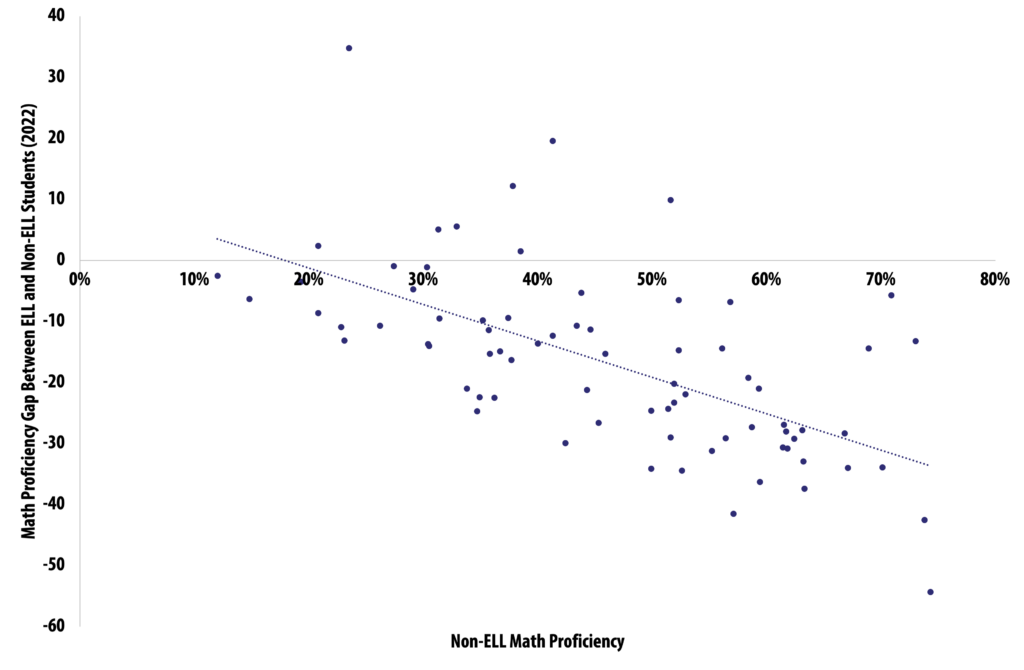
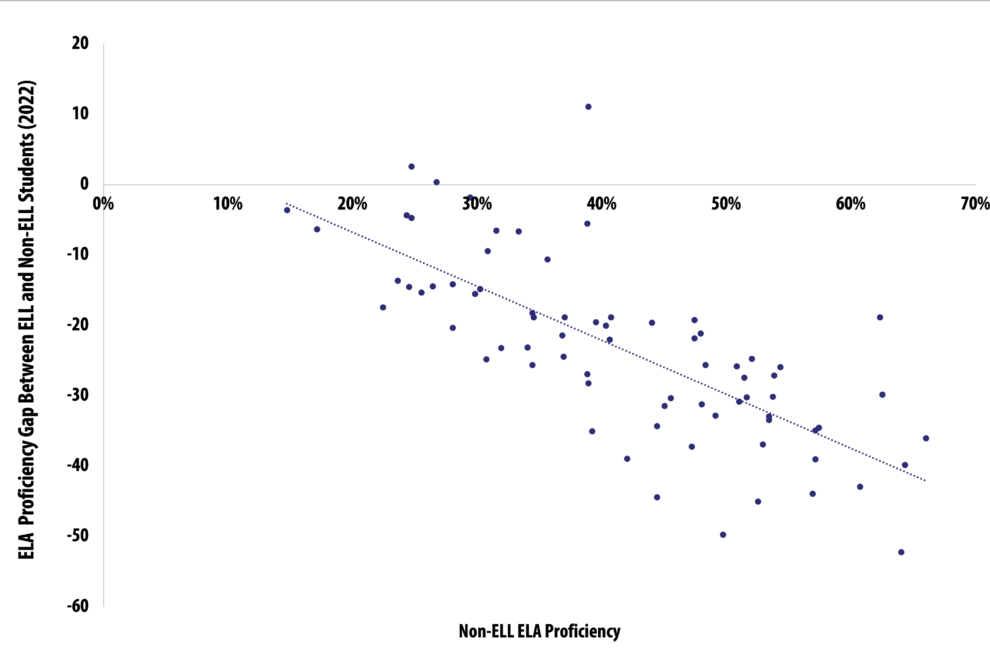
The root of this trend is clear. If non-ELL students are outscoring ELL students, which is the case in most districts, a group of high scoring non-ELL students leaves more room for achievement gaps than a group of low-scoring non-ELL students. For instance, if non-ELL students have a 90% proficiency rate in math, their gap with ELL students can be up to 90 percentage points. In contrast, if non-ELL students have a 50% proficiency rate in math, their gap with ELL students can only be up to 50 percentage points. Even so, the pattern is troubling: ELL students’ scores tend to be low in districts where non-ELL scores are low, but they also tend to be low in districts where non-ELL scores are high. The implications of this are that even districts that are doing well academically are struggling to serve their ELL populations–likely, to some degree, as a result of the challenges that we described earlier in this post.
Strengthening Support
While some districts offer strong support for their ELL students, others have space to improve their programs. Below, we offer recommendations to help strengthen the experiences of ELL students in districts that may currently struggle to support this population.
First, the state’s funding formula needs to be adjusted so that it provides districts with additional funding for their ELL students. When the formula was first implemented in 1997, ELL students made up a marginal proportion of the student population, but this has since changed. Considering the depth of support that ELL students require, it only makes sense to account for these students in the funding formula. The federal funding that school districts receive is not enough to adequately support ELL students, not to mention that the majority of districts with ELL students do not currently receive any federal funding for this population.
Second, each district should ensure that their plan for ELL students is comprehensive, aligned to current research, and tailored to its student and teacher populations–regardless of whether they have a high concentration or low concentration of ELL students. Some of the vital components of a strong plan include professional development for all teachers in best practices for reaching ELL students, plans for engaging families of ELL students, strategies for ensuring the success of these students, and a mode of evaluation to determine the success of ELL programming. MDE offers resources to help develop these plans in addition to offering professional development to teachers upon request. Districts should take advantage of these resources, and MDE should ensure that districts are aware of the services and resources that it offers.
Third, Mississippi Educator Preparation Programs (EPPs) that do not offer ESL endorsement courses should consider incorporating these courses. Currently, only 7 of the state’s 18 EPPs offer the courses necessary for teachers to receive an ESL endorsement, which limits the number of teachers who are able to become trained in this area. Increasing future teachers’ opportunities to receive this endorsement would be a direct way to combat the shortage of teachers who have the skills to support ELL students.
Conclusion
Historically, the plight of English Language Learners in Mississippi has not been prioritized, simply because these students have not made up a large proportion of the student population. This has changed in the past several decades, as the ELL population has grown, a trend that will likely continue into the future. While the MDE has recognized the need to support ELL students, districts in which this population is relatively small still may not see this as a priority. These areas need to be proactive in taking advantage of the resources available to them and in ensuring that their ELL students are well supported. Additionally, as the ELL population grows, the state’s funding formula should be updated to recognize the unique needs of this population, and EPPs around the state need to update their curricula to ensure the state’s teacher workforce is prepared to meet the needs of all students.
1 Title III separately provides funding for schools’ immigrant populations. Schools may receive funding under this section of the program even if they do not qualify to receive funding for their ELL populations.