

Editor’s Note: This is the second part of a two-part series on third grade literacy achievement. You can find the first part here.
***

By Grace Breazeale I K-12 Policy Associate
In the first part of this series, we explored the effectiveness of the Literacy-Based Promotion Act (LBPA) across Mississippi school districts, as well as trends in literacy achievement following the pandemic. Following the passage of the LBPA in 2013, nearly every school district in Mississippi demonstrated growth in third grade literacy scores. The law was remarkably—and nearly universally—effective.
The COVID-19 pandemic brought unprecedented challenges to Mississippi classrooms, disrupting students’ literacy progress. Scores from the 2020-2021 school year reflected these disruptions, as most districts’ third grade proficiency rates were far below the figures from the 2018-2019 school year. Though the state’s average proficiency score rebounded to its pre-pandemic number by 2023, there remain disparities in improvement between school districts.
There are innumerable factors that are related to post-pandemic recovery that either have not or cannot be measured—elements such as the level of academic support students had at home and the health impacts of COVID within individual families. Even so, we were interested in exploring relationships between recovery and the data that we are able to access.
In this post, we examine two of these factors with the intent of beginning to unravel reasons behind differences in improvement: schools’ formats during the 2020-2021 school year, and schools’ classifications as Literacy Support Schools. These analyses can help shed light on best practices for how schools—and the state’s education system as a whole—can proceed in the case of future disruptions.
Possible Factors Related to Recovery
Factor 1: Format During the 2020-2021 School Year
A large and growing number of studies have demonstrated the impact of virtual learning on student achievement in the aftermath of the COVID pandemic. In general, the consensus appears to be that virtual learning has a negative relationship with student achievement, and that schools who implemented this format during the pandemic have been slower to bounce back than their counterparts that returned more quickly to an in-person format.
We set out to explore how this dynamic played out in Mississippi. For the scope of this project, we examined the relationship between schools’ formats during the pandemic and their third grade literacy achievement in the years during and following the pandemic. In particular, we focused on schools’ formats during the 2020-2021 school year, as this was the first full school year following the emergence of the pandemic, as well as the school year in which there was the highest amount of variability in school formats across the state.
Classification System
Determining individual schools’ formats was a challenge due to the flexibility granted to school districts during the pandemic. For the 2020-2021 school, districts were able to adopt a virtual, hybrid, or in-person learning format, or a combination of these. The Mississippi Department of Education (MDE) requested that districts submit their plans prior to the school year and in the middle of the school year, but districts often pivoted at multiple points throughout the year depending on the severity of the pandemic in their communities. Most districts also took advantage of their ability to offer a combination of options to students. Thus, most districts’ formats could not cleanly be put in one category.
Mississippi First developed a resource summarizing district pandemic plans during the 2020-2021 school year, using information from the MDE, district websites and social media pages to track districts’ plans and formats. Though updates on some districts’ plans throughout the school year were unavailable, our database was one of the most comprehensive sources of individual districts’ formats during this time period.
Using information and sources from this database, we established a system to categorize districts based on the default enrollment option in their initial reopening plans. As we described above, each district’s default enrollment options fell into one of three primary categories: in-person learning, virtual learning, or hybrid learning. Several districts did not have a clear default option in their enrollment plan, so we placed these into a separate category. While imperfect, this classification system provides a rough idea of districts’ formats going into the 2020-2021 school year.
Findings
The graph below demonstrates changes in average third grade ELA proficiency over time, based on schools’ default formats during the 2020-2021 school year. Changes in performance are reported as Z-scores, which are the distance of each year’s mean in standard deviations (SDs) relative to the mean score of each group during the 2018-2019 school year. Using this method allows for easier interpretation and comparability of changes in performance.
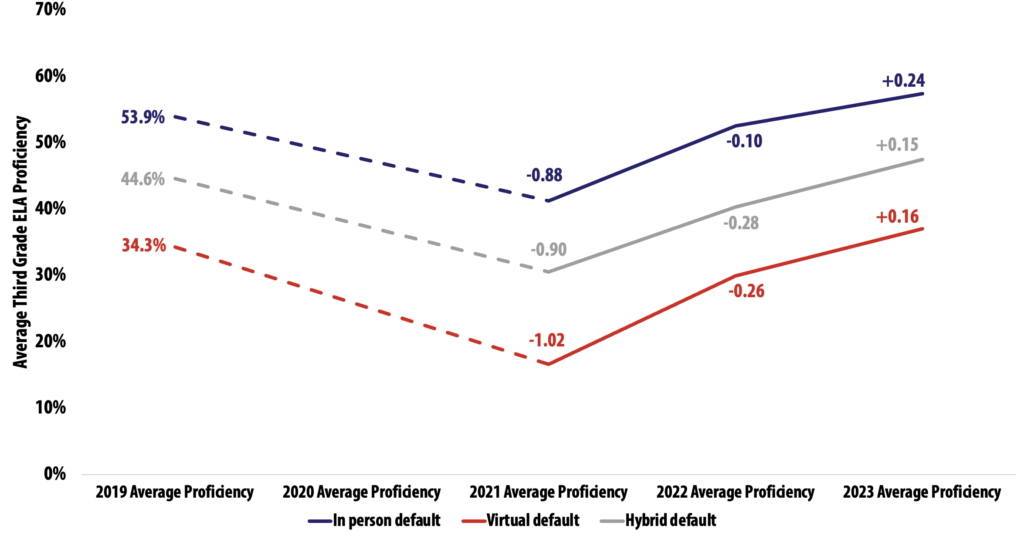
Note: Data labels for 2021, 2022, and 2023 are reported as the distance of each year’s mean in standard deviations (SDs) relative to the mean score from the 2018-2019 school year. Statewide assessments were waived during the 2019-2020 school year due to the emergence of the COVID-19 pandemic.
Let’s examine the information in the figure. We can see that schools with a default virtual learning format had the lowest average baseline proficiency, while schools with a default in-person format had the highest average baseline proficiency. In other words, lower-performing schools were more likely to implement a virtual format during the 2020-2021 school year.
Not only did schools with a default virtual format start out with the lowest proficiency scores, they also experienced the largest decline in proficiency between 2019 and 2021 compared to their peers in hybrid and in-person formats. Students in the “virtual” category experienced a decline of 1.02 SDs, students in the “in-person” category experienced a decline of 0.88 SDs, and students in the “hybrid” category experienced a decline of 0.90 SDs. In other words, schools that implemented a virtual format were already performing lower than their counterparts and fell even further behind during the 2020-2021 school year.
Following this large drop, schools with a default virtual format had a relatively sharp increase in average proficiency in 2022, and a smaller increase in 2023. Unfortunately, these increases were not enough to match the improvement of in person schools between 2019 and 2023. In 2023, virtual schools were 0.16 SDs above their 2019 scores, hybrid schools were 0.15 SDs above their 2019 scores, and in-person schools were 0.24 SDs above their 2019 scores. Further research is necessary to confirm whether or not these varying changes in proficiency were caused by schools’ formats. However, it is clear that schools implementing a virtual format lost ground to schools implementing an in-person format, widening an already-large gap between the two groups.
Factor Two: The Role of Literacy Support
The second factor we examined was whether the classification of a school as a Literacy Support School (LSS) was related to its achievement during the pandemic and years that followed. Under the Literacy Based Promotion Act, a school’s classification as an LSS is related to the percentage of students who scored in the two lowest performance levels the previous year. These schools are provided with literacy coaches trained by the MDE, and the support remains until the school demonstrates improvement on state accountability assessments. Ideally, a school’s literacy coach assists teachers and administrators with developing effective teaching strategies, so that their effects persist even when they are no longer present in the school.
We examined whether the presence of a literacy coach in a school was related to schools’ achievement between the 2018-2019 school year and the 2022-2023 school year. We placed schools into one of two categories: either the school had hosted a literacy coach for at least one school year between the 2019-2020 and 2022-2023 school years, or it did not.
The table below shows the differences in average 3rd grade ELA proficiency between LSS and non-LSS schools between the 2018-2019 school year and 2022-2023 school year. It presents the changes in percentage points as well as standard deviations.
| 2018-2019 Average Third Grade ELA Proficiency | 2022-2023 Average Third Grade ELA Proficiency | Difference | |
| LSS in any year between 2019-2020 and 2022-2023 | 31.2% | 34.8% | +3.5 percentage points (0.30 standard deviations) |
| Not a LSS in any year between 2019-2020 and 2022-2023 | 55.5% | 58.3% | +2.8 pp (0.22 SDs) |
On average, schools classified as Literacy Support Schools at any point from 2019 to 2023 did experience a higher jump in proficiency (0.30 SDs) than schools that were not classified as Literacy Support Schools (0.22 SDs)—a promising signal of literacy coaches’ effectiveness. Even so, the average proficiency scores of schools in the LSS group (34.7%) remained significantly lower than that of the non-LSS group in 2023 (58.3%).
The Intersection of Format and Literacy Support
For the final piece of this analysis, we combined the above categories to examine how literacy support schools and non-literacy support schools of different pandemic-era formats fared between 2019 and 2023. Our results are presented below, with the first table illustrating changes in 3rd grade ELA proficiency for Literacy Support Schools and the second table showing changes for non-Literacy Support Schools. Changes are presented in percentage points and standard deviations relative to the 2018-2019 school year. As in the previous section, Literacy Support Schools included schools that were classified as Literacy Support Schools at any point between the 2019-2020 and 2022-2023 school years.
Literacy Support School 2019-2023
| 2018-2019 | 2022-2023 | Difference | |
| In-person default | 38.2% | 43.5% | +5.3 percentage points (0.34 standard deviations) |
| Virtual default | 27.5% | 31.6% | +4.2 pp (0.38 SDs) |
| Hybrid default | 32.5% | 33.7% | +2.0 pp (0.11 SDs) |
Non-Literacy Support School 2019-2023
| 2018-2019 | 2022-2023 | Difference | |
| In-person default | 57.1% | 60.2% | +3.2 percentage points (0.25 standard deviations) |
| Virtual default | 57.1% | 56.0% | -1.1 pp (0.07 SDs) |
| Hybrid default | 52.2% | 55.3% | +3.1 pp (0.24 SDs) |
Among Literacy Support Schools, schools with a virtual default format experienced the largest score increase (+0.38 SDs) between the 2018-2019 and 2022-2023 school years, closely followed by schools with an in-person default format (+0.34 SDs), then schools with a hybrid default format (+0.11 SDs). Among non-Literacy Support Schools, schools with an in-person default format had the largest increase (+0.25 SDs), followed by schools with a hybrid default (+0.24 SDs), then schools with a virtual default, which actually experienced a slight decline (-0.07 SDs).
The data indicate that being classified as a Literacy Support School may have played the largest role in the improvement of schools that had a virtual default format during the 2020-2021 school year. Literacy Support Schools on a virtual default format experienced significantly more improvement than non-Literacy Support Schools using these formats. The impact of literacy support was less strong in schools with an in-person default format and hybrid default format. Literacy Support Schools with an in-person default experienced marginally higher growth than their non-LSS counterparts, while Literacy Support Schools on a hybrid format had lower growth than their non-LSS counterparts.
Implications
This post provides a peek into a few of the many factors related to third-grade literacy achievement. The relationships we uncovered can not only inform our understanding of the pandemic’s impact but also offer valuable considerations for shaping future decisions and strategies. Implications of our analysis are outlined below.
In-Person Learning: The Gold Standard
As other outlets have noted, the benefits of an in-person learning format are numerous and cannot be easily replicated in a virtual or hybrid format. Our findings underscore the value of in-person learning as the gold standard for student achievement. Districts that defaulted to in-person learning at the onset of the 2020-2021 school year exhibited a greater likelihood of sustaining or surpassing pre-pandemic scores. In the event of a future pandemic or similar disruptive event, all efforts should be made to maintain an in-person learning setting—provided that students’ safety is not at risk.
Coaching Support for Struggling Schools
Our analysis shows a connection between a school’s classification as a Literacy Support School and its level of improvement from 2019 to 2023. It appears that the relationship was strongest for schools that had a virtual default format during the 2020-2021 school year.
Though our analysis is a promising sign that literacy support is beneficial for struggling schools, it is difficult to draw definitive conclusions from our findings because of the fluid nature of the LSS program. We looked at whether a school had received any support during the 2019-2023 time period, and it is possible that some schools in this category had multiple years of support while others only had one year. Moreover, it is possible that some schools in the non-LSS category had received coaching support in the past from which they were still benefitting (via the use of strategies they learned, for example).
Likely, there are a host of other characteristics connected to a school being chosen as a LSS that are also related to student achievement and improvement. Thus, examining the level of improvement of Literacy Support Schools versus non-Literacy Support Schools schools is not an apples-to-apples comparison. To capture the true impact of having literacy support, we would need to be able to capture the schools’ scores in the absence of this support. This brings us to our next point.
Need for Future Research
While our analysis sheds light on connections between school format, literacy support, and third-grade literacy improvement, it is crucial to acknowledge the presence of other factors that are related to achievement gaps. For instance, there is clear evidence of achievement gaps between students of different races and income levels. Future research will be essential in creating a more comprehensive understanding of the myriad variables impacting student literacy achievement and post-pandemic recovery.